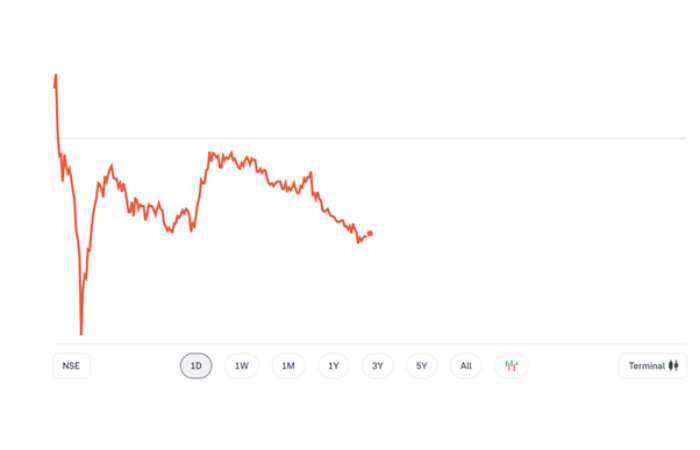
JIO Financial Services
₹333.20

Jio Financial Share Price Performance
- Today Low – 329.30
- Today High – 339.70
- 52 Week low – 204.25
- 52 Week High – 394.70
- Open – 337.95
- Close – 336.85
- Volume – 90,23,570
- Total traded value – 301 Cr
- Upper Circuit – 404.20
- Lower Circuit – 269.50
Market Depth
Buy Order Quantity – 30.37%
Sell Order Quantity – 69.63%
| Bid Price | Qty | Ask Price | Qty |
| 333.25 | 1,299 | 333.35 | 60 |
| 333.2 | 746 | 333.4 | 427 |
| 333.15 | 1,208 | 333.45 | 156 |
| 333.1 | 1,048 | 333.5 | 711 |
| 333.05 | 12,101 | 333.55 | 766 |
| Bid Total | 13,07,502 | Ask Total | 29,98,254 |
Fundamentals
| Market Cap | ₹2,14,042Cr | ROE | 1.15% |
| P/E Ratio(TTM) | 134.76 | EPS(TTM) | 2.5 |
| P/B Ratio | 1.54 | Dividend Yield | 0.00% |
| Industry P/E | 19.94 | Book Value | 219.02 |
| Debt to Equity | 0 | Face Value | 10 |
Understand Fundamentals
Financials
Revenue
Quarterly
- Jan 23 – 414
- Sep 23 – 608
- Dec 23 – 414
- Mar 24 – 418
- Jun 24 – 418
Yearly
- 2023 – 44.84
- 2024 – 1,855
Profit
Quarterly
- Jun 23 – 332
- Sep 23 – 668
- Dec 23 – 294
- Mar 24 – 311
- Jun 24 – 313
Yearly
- 2023 – 31.25
- 2024 – 1,605
Net Worth
Yearly
- 2023 – 1,14,120
- 2024 – 1,39,148
| PARTICULARS | 2023 | 2024 |
| Revenue | 44.84 | 1,855 |
| Expenses | -4.5 | 327.31 |
| EBITDA | 49.34 | 1,988 |
| EBIT | 49.34 | 1,966 |
| Profit Before Tax | 49.34 | 1,956 |
| Net Profit | 31.25 | 1,605 |
Financial Ratios |
||
| Operating Profit Margin | 110.04% | 87.06% |
| Net Profit Margin | 69.69% | 70.28% |
| Earning Per Share (Diluted) | 60.46 | 2.53 |
| Dividends Per Share | 0 | 0 |
About Jio Financial Services
Jio Financial Services Ltd is a company based in the India. The Company is a non-deposit taking NBFC that means it does not take deposit from the public. The Company’s solutions are extensive, its infrastructure and presence physical and digital facilitating accessibility and convenience for people of all categories in society.
JIO Financial Services Shareholding Pattern
- Promoters – 47.12%
- Retail And Others – 23.44%
- Foreign Institutions – 17.55%
- Other Domestic Institutions – 7.84%
- Mutual Funds – 4.04%
Top Mutual Funds Invested(4)
| FUND NAME | AUM(%) |
| Motilal Oswal Midcap Fund Direct Growth | 9.95% |
| Quant Absolute Fund Direct Growth | 8.18% |
| Quant Focused Fund Direct Growth | 7.73% |
| Quant Multi Asset Fund Direct Growth | 7.30% |
Similar Stocks
| COMPANY | PRICE | P/E | P/B | MKT. CAP | 52W L | 52W H |
| Muthoot Finance | 1,983.35 (+0.34%) | 17.76 | 3.14 | ₹79,331.27Cr | 1,182.35 | 2,012.10 |
| SBI Cards | 804.9 (+0.53%) | 31.6 | 6.3 | ₹76,132.15Cr | 647.95 | 857.8 |
| Tata Investment … | 7165.4 (+0.46%) | 97.67 | 1.2 | ₹36,065.84Cr | 2,437.95 | 9,756.85 |
| Poonawalla Finc … | 380.7 (-1.19%) | 17.12 | 3.67 | ₹29,939.48Cr | 336.3 | 519.7 |
| Authum Invstmnt | 1623.5 ₹ 1,623.50 | 5.39 | 2.7 | ₹27,917.44Cr | 732.2 | 1,830.00 |
| Piramal Enterpri … | 1049.5 (-0.31%) | -11.81 | 0.89 | ₹23,738.29Cr | 736.6 | 1,139.95 |
| IIFL Finance | 455.9 (-2.28%) | 12.17 | 1.66 | ₹19,795.14Cr | 304.28 | 683.25 |
FAQs of Jio Financial Share Price
How to Buy Jio Financial Services Share?
You can easily buy Jio Financial Services shares in Groww by creating a demat account and getting the KYCdocuments verified online.
What is the Market Cap of Jio Financial Services?
Market capitalization, short for market cap, is the market value of a publicly traded company’s outstanding shares. The market cap of Jio Financial Services is ₹2,14,042 Cr as of 8 Sep ’24.
What is the PE and PB ratio of Jio Financial Services?
The PE and PB ratios of Jio Financial Services is 134.76 and 1.54 as of 8 Sep ’24
What is the 52 Week High and Low of Jio Financial Services?
The 52 week high/low is the maximum and minimum price at which a Jio Financial Services stock has been exchanged within the particular period of one year and comes under technical analysis. While Jio Financial Services has been through its high and low points in a single year, its 52 week high and low is ₹394. 70 and ₹204. 25 as of 8 Sep ‘24.
Also Read:

